This is a page where I describe some fundamental aspects of biology that might be too long to explain in other posts.
Table of Contents
How DNA is expressed to make proteins
DNA contains genes that can be expressed to make proteins
You’ve heard that DNA is the blueprint of life. Our genome, or our total DNA, provides the instructions that are needed for all of our cells to function. Our genome contains 3.2 billion “letters” of DNA.
Our genome is like an enormous series of encyclopedias made up of many different chapters, or genes, that each describe how to make a protein, like the hormone insulin, or antibodies, or collagen or hemoglobin! There’s about 20,000 proteins in the human body and they all have a specific function for our cells and body to work properly.
In biochemistry a protein is just a molecule made of amino acids.
It’s like how you can build things with Lego. Each Lego piece is an amino acid and there’s only 20 kinds of them. Overall you can build anything you want to make a specific shape that has a specific function.
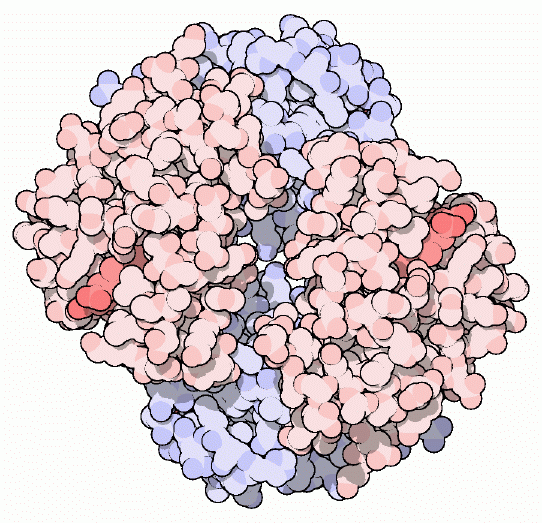
Next is an image of the protein hemoglobin, the protein that transports oxygen to our cells (ignore the colors), made up of about 300 amino acids:
DNA provides the instructions for making these proteins in the form of genes.
For a given task, like cell division, certain proteins need to be produced that are specialized for cell division. So the cell sends signals to turn on genes for cell division. When these genes are “turned on,” they’re expressed to make the protein for that gene. There’s two distinct steps during gene expression: transcription and translation.
Briefly, a gene from DNA is copied (transcribed) to make the related molecule RNA (instead of DeoxyriboNucleic Acid, RNA is RiboNucleic Acid). This RNA copy of the gene, which contains the same instructions as in the gene, is used to assemble a protein during translation.
Gene expression consists of transcription and translation
For a gene to turn into a protein, the gene needs to be “expressed,” and this consists of two steps called transcription and translation.
When the cell wants a certain protein, it copies the DNA to make the related molecule “RNA” in a process called transcription. The RNA that results from transcription can also be called a “transcript,” because it’s a copy of the DNA message.
The reason DNA is copied to make RNA transcripts is because there’s tens of thousands of genes in the genome, and you wouldn’t want all of them converted into a protein! It’s kind of like if you go to a restaurant and order the steak, you don’t want the kitchen to make everything on the menu, so your waiter takes your order (RNA) and delivers only the steak.
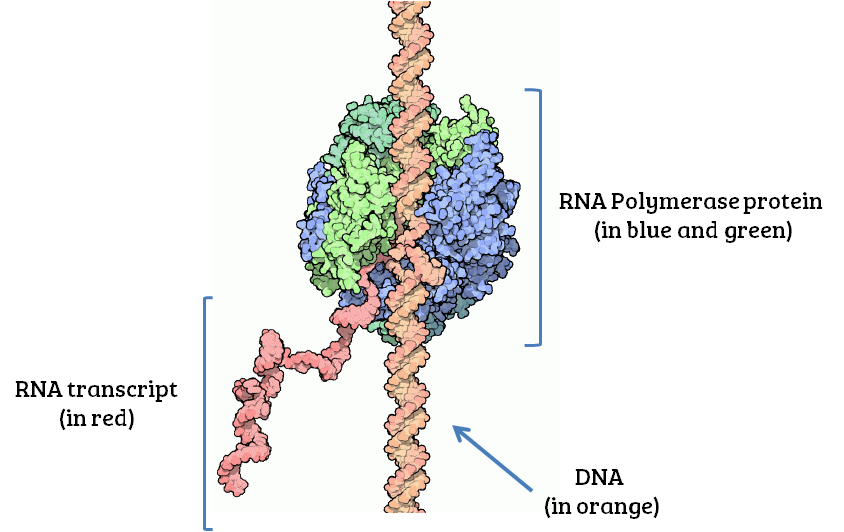
Proteins called RNA polymerases are responsible for making RNA transcripts from DNA. They attach to a gene in DNA and “print out” an RNA transcript as they move along the gene. Here’s a snapshot of what this looks like:
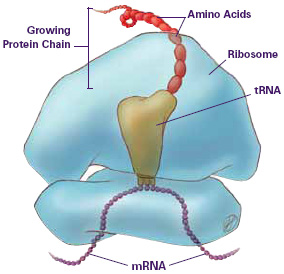
The RNA transcript is then used to synthesize a protein in a process called translation, which involves a molecular machine called a “ribosome.”
The ribosome translates the RNA transcript (also called messenger RNA, or mRNA) and brings together amino acids to make the protein. The ribosome moves along the RNA transcript (mRNA below) and special carrier molecules called transfer RNAs (tRNAs) match amino acids with the code in the RNA. You can see this below:
A gene might be made up of thousands of “letters” and these correspond to a specific amino acid sequence that is unique to that gene and can make a protein that has a specific function.
This process of DNA –> RNA –> protein is called “the central dogma of molecular biology” and is how our cells produce proteins from DNA.
If your body needs more insulin, it expresses the gene for insulin:
- The cell copies the gene for insulin to make insulin RNA.
- Insulin RNA is translated to make the insulin protein.
Next I’ll share an awesome video of the process. To introduce what you’ll see: The first part of the video shows DNA being transcribed to make RNA (using the protein RNA polymerase), then the RNA transcript is edited to remove certain parts (introns — a type of non-coding DNA — which I didn’t get into), then the edited transcript is translated into a protein by the ribosome.
I really encourage every living thing to watch this. This is what’s happening in everyone right now!!
Statistics
Standard Deviation
So let’s say you’re talking about success rates for transferring embryos. And someone tells you that you have a 50% chance of a live birth.
This number that you’re hearing is an average of many different transfers, from many different clinics.
The problem with just looking at the average is it doesn’t give you the whole picture. Some clinics have higher success rates than others, but what kind of range can we expect?
With standard deviation, you get an idea of this. It tells you have variable the data is. For example:
- Let’s say half of the clinics get 100% live births, and the other half get 0% live births. The average is 50% and the SD is 50%. This means that the data can deviate from the average by 50%.
- On the other hand, if half the clinics get 52% live births, and the other half gets 48% the average is still 50% but now the SD is only 2%.
When the SD is high, there’s a huge range of possibilities. When it’s low, you have a tighter spread. So it’s good information to have!
The SD will also tell you how likely you are to fall within a certain range.
Let’s look at this example. Most babies weigh within a certain range that we consider normal. Here is the distribution of birth weights in babies:
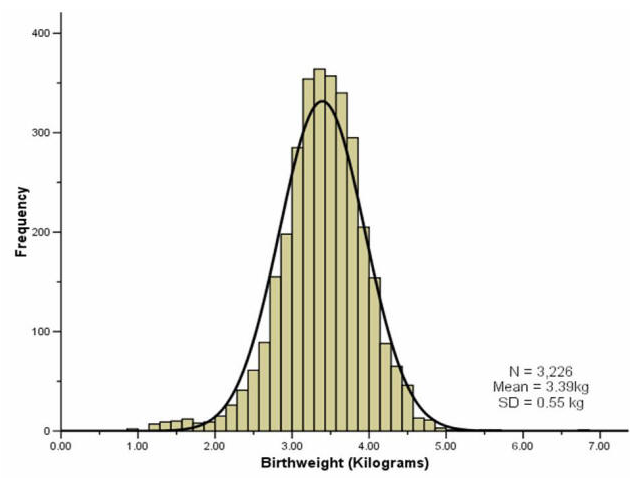
Most are in the middle, but some weigh less and some more. The mean (average) birth weight is 3.39 kg and the standard deviation is 0.55 kg.
The interesting thing about SD is that 1 SD from the average represents 68% of the weights, 2 SD is 96%, and 3 SD is 100%:
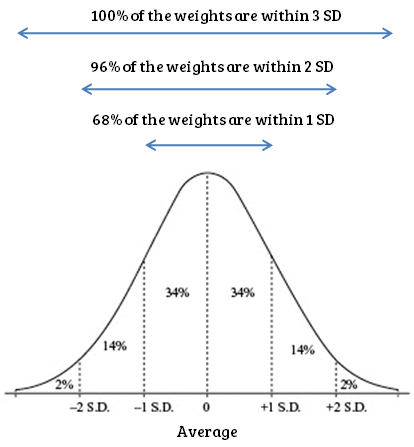
So, you can say that 68% of newborns weigh between 2.84 kg – 3.94 kg because this is 1 SD from the average. You can also say that any baby has a 68% chance of being between 2.84 kg – 3.94 kg.
Now let’s go back to our embryo transfer success example.
From the CDC for 2016, the chances of live birth for women under 35 are reported for nearly 300 clinics. The average is 46% with an SD of 11%.
The range for this is 35% – 57% (average is 46%). (To calculate this, 46% – 11% (1 SD) = 35%; 46% + 11% (1 SD) = 57%.)
So if you’re under 35, you have:
- A 70% chance of being in the 35% – 57% group (1 SD)
- A 14% chance of being in either the 24% – 35% or the 57% – 68% group (2 SD)
- A 2% chance of being <24% or >68% (3 SD)
Usually only 1 SD is reported as this is where the majority (68%) lies.