Relative Risk (RR), Odds Ratios (OR), and Hazard Ratios (HR) are statistical tools used in research to compare the chance of an event happening between two groups. They describe relative changes and NOT absolute differences. These measures are called “relative” because they compare the outcomes between two groups by showing how much more or less likely something is to happen in one group compared to the other, rather than giving exact (absolute) numbers.
What are absolute and relative differences?
For an increase in live birth from 30% to 45% after a treatment, we could describe this in terms of an absolute increase or relative increase:
- With the absolute increase, we would say there’s a 15% better chance of live births in the treatment group (45% – 30% = 15%).
- Using a relative increase, we would say that the treatment increases the success rate by 50% (since 50% of 30% is 15%, and 30% + 15% = 45%). This 50% relative increase highlights how significant the improvement is in relation to the starting point or baseline.
Comparing things using a relative differences is valuable because it allows for easier comparison of results across different studies, even if the baseline success rates vary.
What are relative risk, odds ratios and hazard ratios?
These values help us understand how much more or less likely an event is to occur in one group compared to another.
Relative risk (RR) is a statistic used to compare the probability of an event occurring between two groups. For instance, if 20% of women in a control (untreated) group have live births compared to only 10% in the treatment group, the RR of a live birth in the treatment group compared to the control group is 0.5 (10% divided by 20% = 0.5). This RR tells us that live births are half as likely in the treatment group than in the control group, representing the ratio of the probability of live births in both groups. A RR of 1.00 means there is no change in risk between the two groups. It’s important to note that the RR doesn’t provide the exact numbers or percentages of live births; instead, it shows how the likelihood of live births in one group compares to another.
Odds ratios (OR) are similar to relative risk but use odds instead of probabilities. Odds represent the ratio of events happening to not happening. For example, if you roll a 6-sided dice, the probability of rolling a 6 is 1 in 6, or about 17%. However, the odds of rolling a 6 are 1 to 5 (or 1/5 = 20%), because there is 1 way to roll a 6, and 5 ways not to roll it.
How are relative risk (RR) and odds ratios different? If taking medication X gives a relative risk of 1.25 for live births, it means that taking the medication makes live births 25% more likely compared to not taking it. On the other hand, an odds ratio of 1.25 means that for every 100 live births in the group not taking the medication, there are 125 live births in the group that does take it.
A hazard ratio (HR) is similar to relative risk, except it’s looking at one particular point in time compared to the overall results. For example, if a study is comparing live birth rates after taking a supplement for a year, the relative risk would look at the overall results after a year while the hazard ratio might look at 3 months, or 6 months.
What makes an odds ratio statistically significant? Understanding the 95% confidence interval
Normally you’ll see a p value to indicate statistical significance. A p value that’s less than 0.05 is usually accepted as statistically significant. Generally, if p<0.05 then there’s a 95% chance that the results aren’t due to chance alone and we use this as a convention to accept that it’s statistically significant. Anything p>0.05 is not statistically significant.
Statistical significance can also be assessed by the confidence interval when looking at relative risk ratios, odds ratios or hazard ratios. This interval shows the range within which the true odds ratio value likely falls. For example, if the OR is 1.30 with a 95% CI of 1.20 to 1.80, it means we are 95% confident that the true odds increase is between 1.20 to 1.80 (or 20% to 80%) more than the control group.
If the 95% confidence interval includes 1.00, then it is not statistically significant:
- An odds ratio [95% CI] of 1.25 [0.99-1.33] isn’t significant.
- An odds ratio [95% CI] of 1.25 [1.01-1.35] is significant, and indicates an increase in odds of 25% (25% comes from 1.25 here, because 1.25 – 1.00 = 0.25 or 25%).
- An odds ratio [95% CI] of 2.0 [1.50-2.50] is significant, and indicates an increase in odds of 100%, or a doubling of the odds.
- An odds ratio [95% CI] of 0.95 [0.8-0.99] is significant, and indicates an decrease in odds of 5% (1.00 – 0.95 = 0.05 or 5%)
When are these values clinically significant? RR values are usually clinically significant if they are less than 0.5 (the risk is reduced by half) or more than 2.00 (the risk is doubled). However, even a RR of 1.00 can be important depending on the context. See this guide for more info.
Besides relative risk, odds ratios, etc. sometimes we’ll see analyses for an increase in the number of eggs or endometrial thickness. For this, it’s usually expressed as a “mean difference,” and in this case if the 95% confidence interval crosses 0 it’s not significant:
- A mean difference [95% CI] of 0.1 [-0.25 to 0.3] for eggs retrieved isn’t significant.
- A mean difference [95% CI] of 0.5 [0.25 to 0.66] for eggs retrieved is significant, and indicates that an average of 0.5 more eggs was retrieved.
- A mean difference [95% CI] of -0.5 [-0.25 to -0.66] for eggs retrieved is significant, and indicates that an average of -0.5 eggs was retrieved (or 0.5 fewer eggs was retrieved).
How to convert an odds ratio back into a live birth probability?
The odds ratios are handy for seeing the magnitude of the effect of a treatment, but how can you convert it back into the live birth rate, or pregnancy rate probabilities so it makes more sense? To do this, we have to convert the probability of live birth to odds, then apply the odds ratio, then convert it back to probability. As far as I can tell, this method is mathematically correct, but if anyone reading this knows better, please let me know!
Let’s look at an example of how a 1 mm increase in the thickness of the endometrium can impact your probability of live birth. A study by Schmiech et al. (2025) found that the odds of live birth increased by 19% (odds ratio [95% CI]: 1.19 [1.16-1.22]) for each 1 mm increase in endometrial thickness.
Starting Point: Imagine you’re starting with a 40% chance of achieving a live birth in your current cycle. This is your baseline probability. You might get this from your age, or the number of embryos transferred, etc.
Step 1: Convert your live birth probability to odds
- First, we convert your probability (40%) into the odds. The formula looks like this:
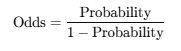
- Plugging in your numbers:
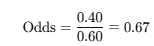
- This means, before any changes, your odds of having a baby are 0.67 to 1, or simply 0.67.
Step 2: Apply the odds ratio
- Let’s say the odds ratio for a 1 mm increase in endometrial thickness is 1.19. This means each mm increase in thickness improves your odds by 19%. We calculate the new odds by multiplying the original odds by this odds ratio:

- Note: For a 2 mm increase (and not 1 mm as in this example), we would multiply the odds ratio twice (or raise it to the power of two).
Step 3: Convert the new odds back to probability
- Now, we convert these new odds back into a probability to understand what they mean for you:
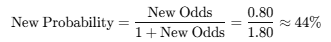
- With the increase in endometrial thickness, your chance of live birth has increased from 40% to about 44%.
Summary: By increasing the endometrial thickness by just 1 mm, your chances of success in an IVF cycle can improve from 40% to approximately 44%.